Configurator tool
The references in this chapter are from the Si2a–PD model.
Camera page
Introduction
Position the camera so that the field of view includes electrical assets such as high-voltage bushings, insulators, transformers, or switchgear, and the camera will begin to detect partial discharge activity. All detected events can be viewed, configured, and analyzed through the configurator tool.
Creating monitored areas
Create at least one monitored area to be able to analyze detected activity, generate alarms, capture snapshots, and review historical trends.
In the camera view of the configurator tool, click the Create Alarm button to enable drawing mode.
Use the mouse to draw a rectangular monitored area over the asset or HV component of interest.
Enter the following information:
Area name
Component type
Distance to camera
Line voltage of the monitored equipment
Click Save area.
This action opens the Alarm creation window.
You may add an alarm or save without assigning alarms.
Click on Stop drawing mode.
Assigning alarms
You can assign alarms to each monitored area if alarm notifications are required for PD events.
Open Edit regions > Alarms.
Click Add alarm.
Enter an alarm name.
Select the PD Type, or leave it set to Any PD to trigger on all detected types.
Choose the minimum severity level that must be reached to activate the alarm.
Low: Triggers on any PD event, regardless of severity.
Medium: PD severity must reach at least 25% to trigger the alarm.
High: PD severity must reach at least 50% to trigger the alarm.
Very high: PD severity must reach at least 75% to trigger the alarm.
Select the lowest Sound pressure level (SPL) that would trigger the alarm. It is recommended to keep it at the lowest value.
In each monitored area, the analysis is performed on the strongest detected sound source present at the time of analysis. Weaker sound sources can sometimes be masked by strong sound sources either within or outside the monitored area, resulting in these weaker sound sources not being detected.
Alarm advanced options
Adjust the following parameters to refine the alarms when they are triggered:
Minimum interval, the minimum time required between two consecutive alarm events.
Minimum duration, the minimum time a PD event must persist before triggering the alarm.
The minimum duration must be less than or equal to the minimum interval.
Alarm actions
Configure output actions for each alarm by selecting the desired output:
4–20 mA current loop output.
Digital output signals.
For set up instructions, see section 4–20 mA Current Loop Settings and Digital input output settings.
Alarm events
When alarms are triggered, the most recent active alarms will appear in the Camera View, see Figure 1.
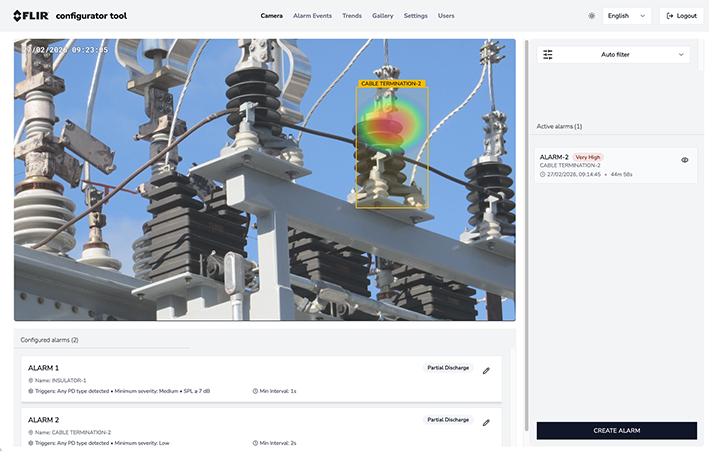
Figure 1. Active alarm list is displayed on the right side of the camera view.
Click alarm to view detailed event information.
The Alarm Event tab lists all historical alarm events, which can be sorted by:
Severity
Time of occurrence, see Figure 2
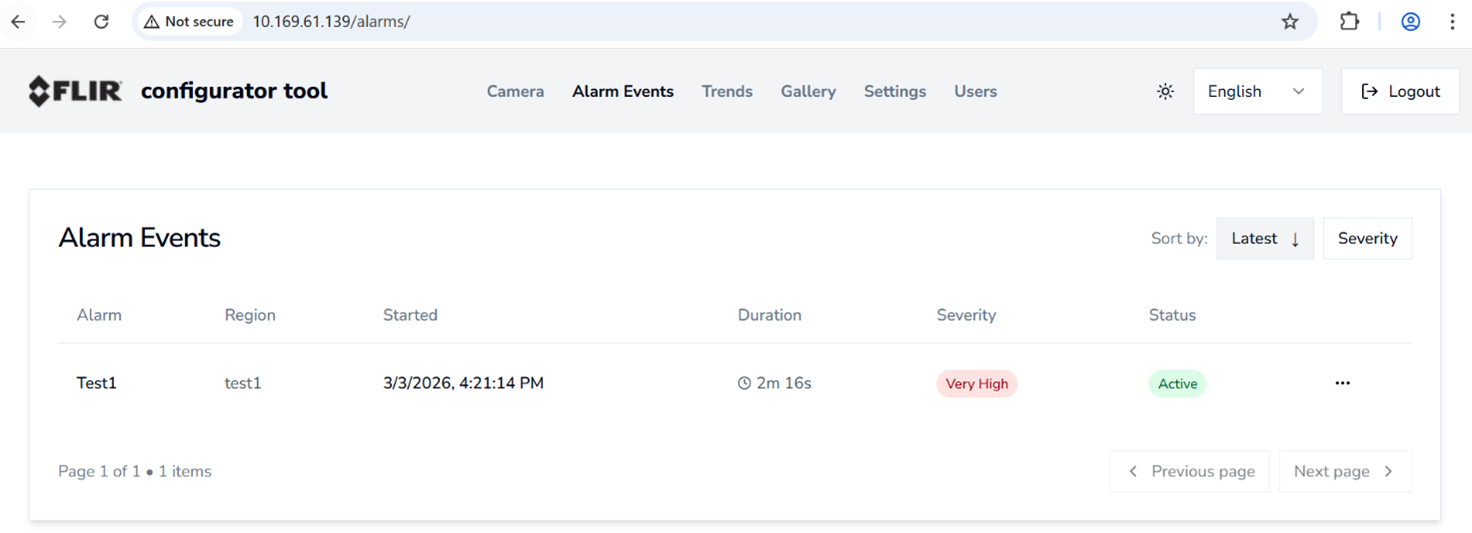
Figure 2. Alarm event list.
PD Detection
When a PD event occurs within a user‑defined monitored area, the camera displays additional analytics such as:
PD type
PRPD Pattern
SPL Value
Severity level
These details appear when the user hovers the mouse pointer over the monitored area.
If multiple PD sources are present across different monitored areas, each region will display PD information independently.
Capturing snapshots
Snapshots come from triggered alarms or are manually captured by the operator.
Hover the mouse pointer over the selected monitoring area.
Click the Snapshot/Camera icon.
Captured snapshots appear in the Gallery tab, see Figure 3.
Click on a snapshot to view details:
The associated monitored area will be highlighted by default and marked with a camera icon.
Users may switch between monitored areas within the snapshot.
NoteThe most accurate, updated data corresponds to the area originally associated with the snapshot. This region would be shown with the camera icon.
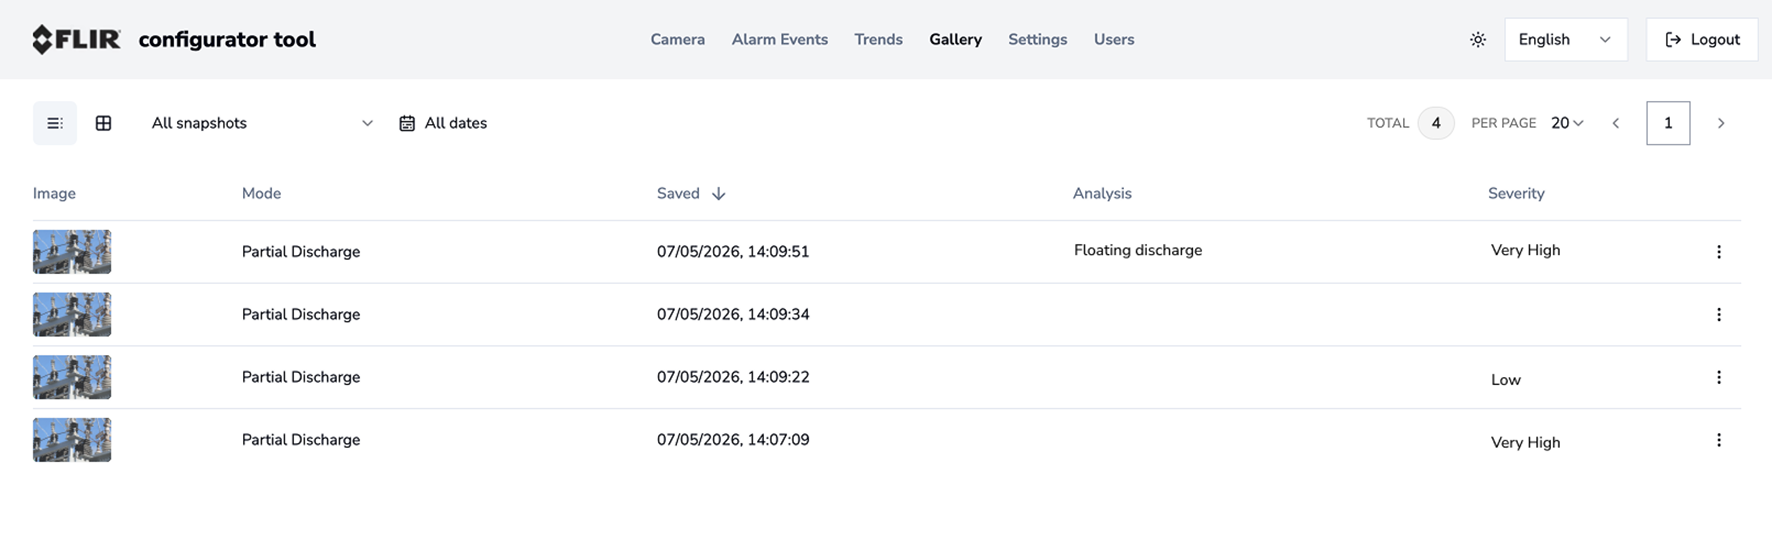
Figure 3. Snapshots gallery.
Scroll down to reveal additional PD analytics, including:
PRPD pattern
PD type
Description
Recommendation
Severity level
Downloading snapshots
In the snapshot list, click the three dots (⋮) next to the desired snapshot.
Select Download.
Files are saved in .NLZ format.
These files can be opened in Thermal Studio for:
Offline viewing
Advanced analysis
Report generation
Historical data trending
Historical events and their associated analytics can be viewed in the Trends tab of the configurator tool. The Trends page provides access to historical measurement data, enabling users to track changes in PD activity, identify patterns, and review long‑term behavior of monitored assets. Adjust the trend settings for data measurement period and storage period in the trend settings, see section Trend settings.
The page is divided into two main sections:
PD type timeline.
Displays the PD type detected at each measurement time, allowing the user to understand how the PD type evolves over time.
Severity trend.
Shows how the PD severity levels have changed for the selected monitored area over the chosen time range. Users can choose to display or hide any of the severity curves:
Maximum severity.
Average severity.
Minimum severity.
Understanding the chart
The severity chart includes the following features:
Three severity lines.
Maximum severity (darkest line).
Average severity.
Minimum severity.
Background severity zones.
Green: Low severity (0–25).
Yellow: Medium severity (25–50).
Orange: High severity (50–75).
Red: Critical severity (75–100).
Click on a data point to view detailed measurement information.
Using filters
The Trends tab includes multiple filter controls:
Date range selector, allows users to view data over specific time periods.
Region filter, displays trend data for a selected monitored area.
The chart legend also allows users to show or hide individual severity curves.
Exporting data
Download historical trend data.
Click Export CSV.
The filtered trend dataset will be saved as a CSV file.
This file can be opened in spreadsheet applications (e.g. Excel) for offline analysis and reporting.
Camera settings
Network settings
Connection
See section Manage network connections and Enable access point.
SMTP
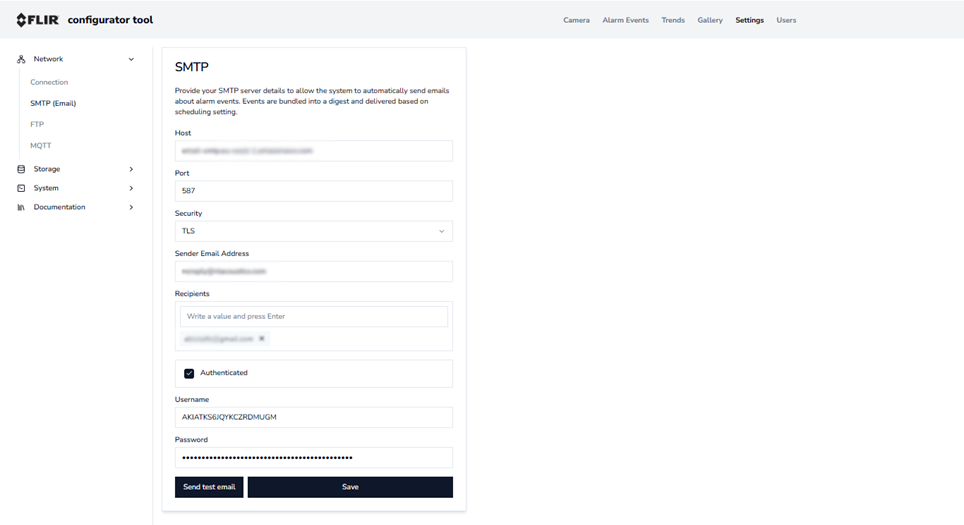
Figure 4.
Enter your SMTP server details to enable the system to automatically send weekly emails about the PD types detected in the user‑defined regions.
FTP
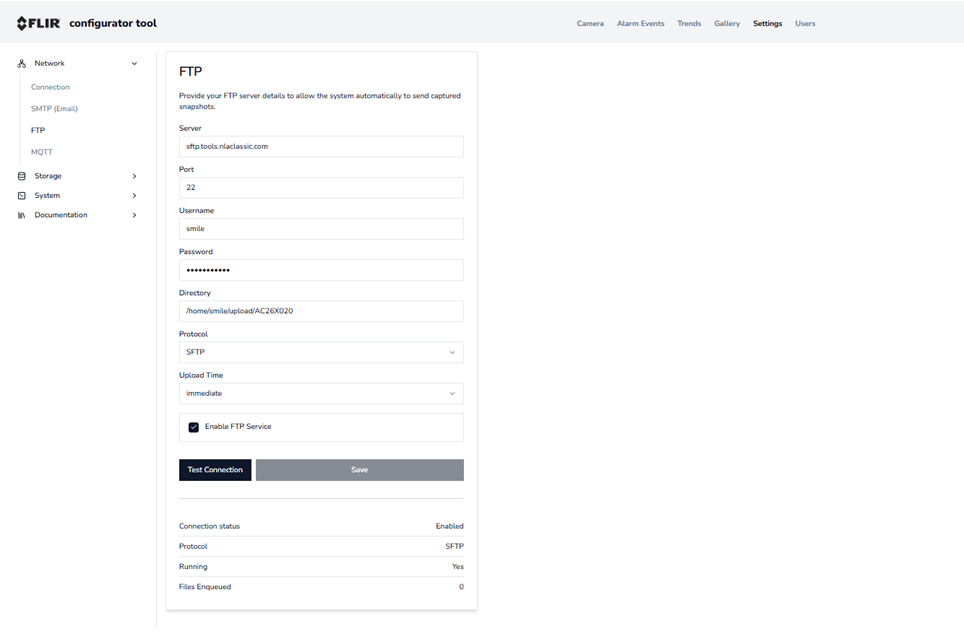
Figure 5.
Enter FTP server details to allow the system to automatically send captured snapshots.
MQTT
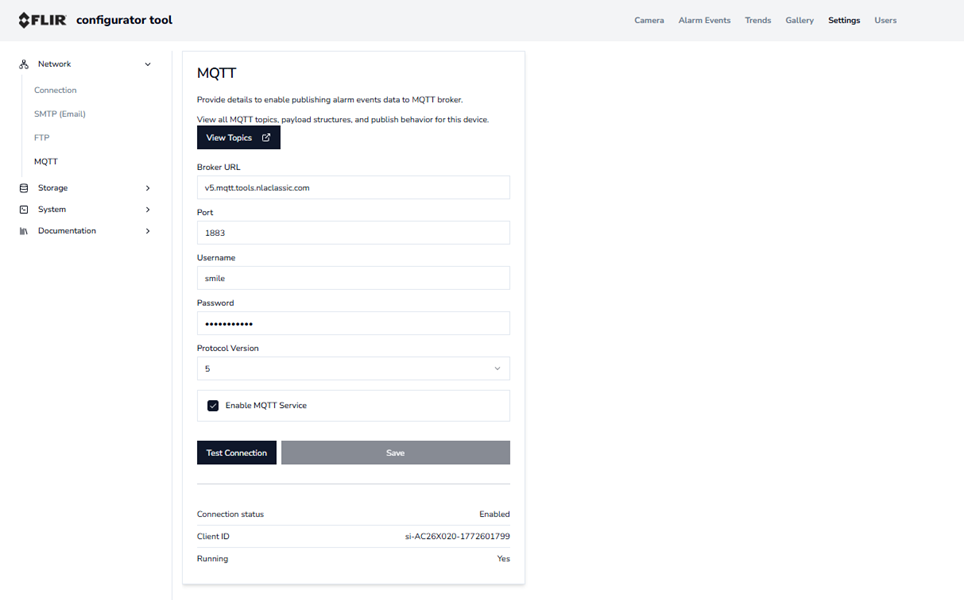
Figure 6.
Enter information to allow alarm event data to be published to the MQTT broker.
Storage management
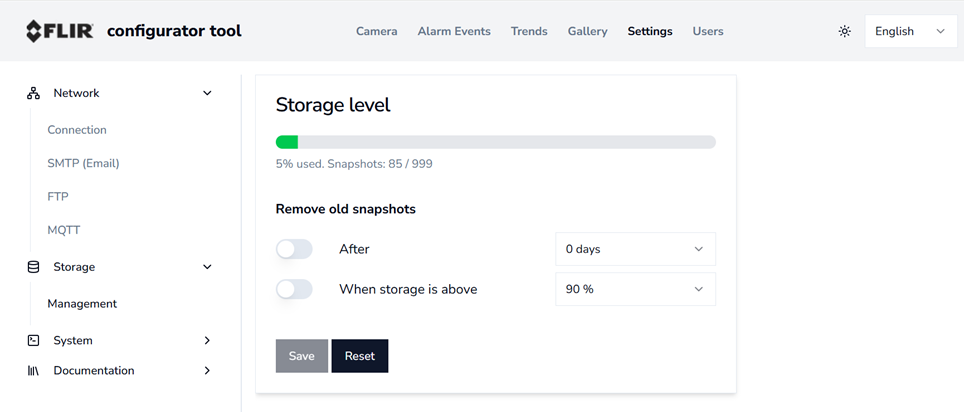
Figure 7.
See the current storage usage of the camera and set the time or storage limit to clear the sorted snapshots.
System
General settings
This section allows configuration of the general system parameters for the camera, including:
Date and time
Units of measurement
Currency format
Environmental reference parameters
Select camera focus mode
These settings ensure accurate reporting and proper display of measurement information.
Trend settings
Configure trend‑related parameters:
Measurement Interval, defines how frequently the camera records measurement data.
Data Retention Period, determines how long historical trend data is stored in the system.
Adjust these values to balance data resolution and storage time.
4–20 mA Current Loop Settings
The camera has a configurable 4–20 mA current loop output that can be used to report alarm events to external systems. The 4–20 mA channel must be enabled individually for each alarm that will use it.
Minimum value.
Selectable from 6 mA to 18 mA in 2 mA steps, use the drop‑down menu.
The selected minimum value is continuously output when the camera is in normal (no‑alarm) condition.
The alarm current value must be higher than the minimum value, see section Alarm actions.
Test Signal Value.
Test the 4–20 mA output by selecting a test current from the drop‑down menu.
Select the desired test current value (must be higher than the minimum value).
Click Run Output Test.
The camera will output the selected current for 10 seconds for verification.
Digital input output settings
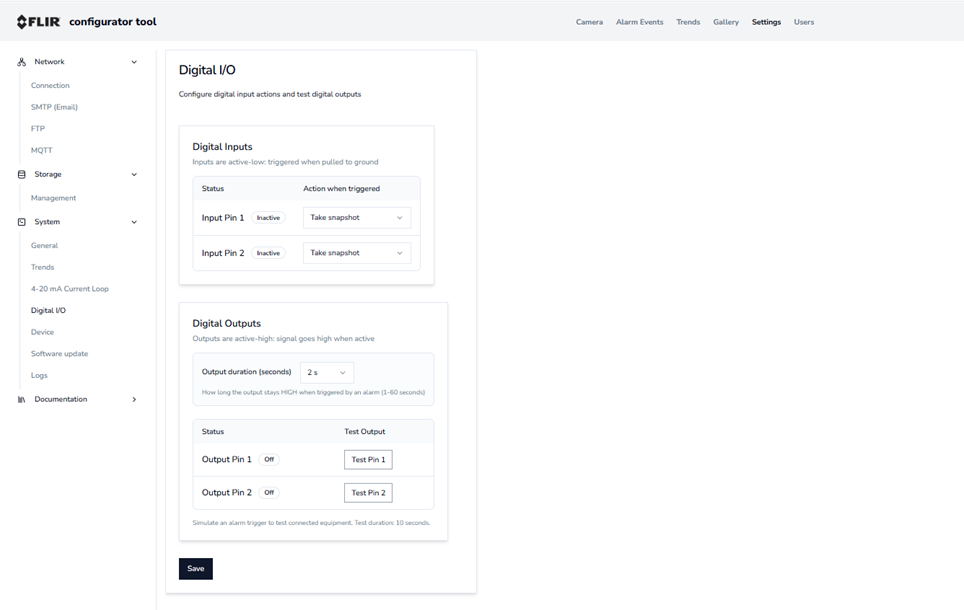
Figure 8.
Digital input.
The camera supports two digital inputs.
Inputs can be configured to perform actions such as rebooting the device or capturing a snapshot.
Digital inputs operate in an active‑low configuration:
The input is considered active (ON) when the signal is pulled to ground.
Digital output.
The camera provides two digital outputs that can be associated with alarms.
Outputs must be assigned in Alarm Settings.
The page also allows to test each digital output:
Select the output duration.
Click Test Pin 1 or Test Pin 2 to activate the output.
Digital outputs operate in an active‑high configuration:
The output is considered active (ON) when the signal is driven high.
Device
Device Information, displays important information about the camera, including:
Serial number
Software version
Electronic label (e-label)
Additional device identifiers
System, shows the camera's resource utilization, including:
CPU usage
Memory usage
This information is useful for diagnostics and performance monitoring.
Software update
Camera software update
Take advantage of the latest camera software, it is important to keep the camera up to date.
Update the camera software, make sure the correct software update file is saved on the computer. Go to the product page or contact Flir Customer Support to obtain the update file.
Perform a software update
Open the configurator tool and navigate to Settings > System > Software Update.
The current software version installed on the camera will be displayed on this page.
Click Software Update, browse to locate and select the update file stored on your PC.
The configurator tool will begin updating the camera firmware.
Do not disconnect the camera from the network during the update process.
The camera will temporarily suspend normal functions, including detection, alarm triggering, and snapshot capture, while the update is in progress.
After a successful update, the camera will automatically return to the Live view screen.
The software version number on the update page is updated to show the newly installed version.
Logs
Use this section to download diagnostic log files containing detailed system information. These logs can be sent to technical support to assist with troubleshooting and problem resolution.
Documentation
API Documentation
Provides interactive documentation for the device’s REST API.
Use this section to:
Explore available API endpoints.
View request and response structures.
Test API calls directly from the browser.
MQTT topics
Topic names
Payload examples
Parameter descriptions
This information is necessary to integrate the camera into external monitoring or automation systems.