Gas quantification images
This chapter describes how to view, edit, and create reports based on gas quantification images and videos from FLIR optical gas imaging cameras.
The gas quantification functionality is only available in Thermal Studio Pro version and for quantification images from the G-series cameras.
Optical gas imaging cameras
The FLIR G-Series is IR cameras for optical gas imaging (OGI) that visualizes and locates leaks of Volatile Organic Compounds (VOCs) without the need to shut down operations. The FLIR G-Series is used in industrial settings such as oil refineries, natural gas processing plants, offshore platforms, chemical/petrochemical industries, biogas, high-voltage equipment and power generation plants.
The gas quantification image files from OGI cameras have the extension .jpg and the radiometric videos have the extension .csq.
For more information, see user´s manual FLIR G series.
View gas quantification images and videos
In the Library tab, you can view your gas quantification images. When you click on a valid file in the center pane, the image or video details and measurement results are shown in the pane to the right. For videos, the displayed preview image is the last frame in the video recording.
To open the quantification image or video in the image editor, double-click the file or click Edit image in the right pane. In the image editor, you can only view the image or video file, you cannot edit the information. The image below illustrates the appearance of the image editor when a gas quantification image is selected.
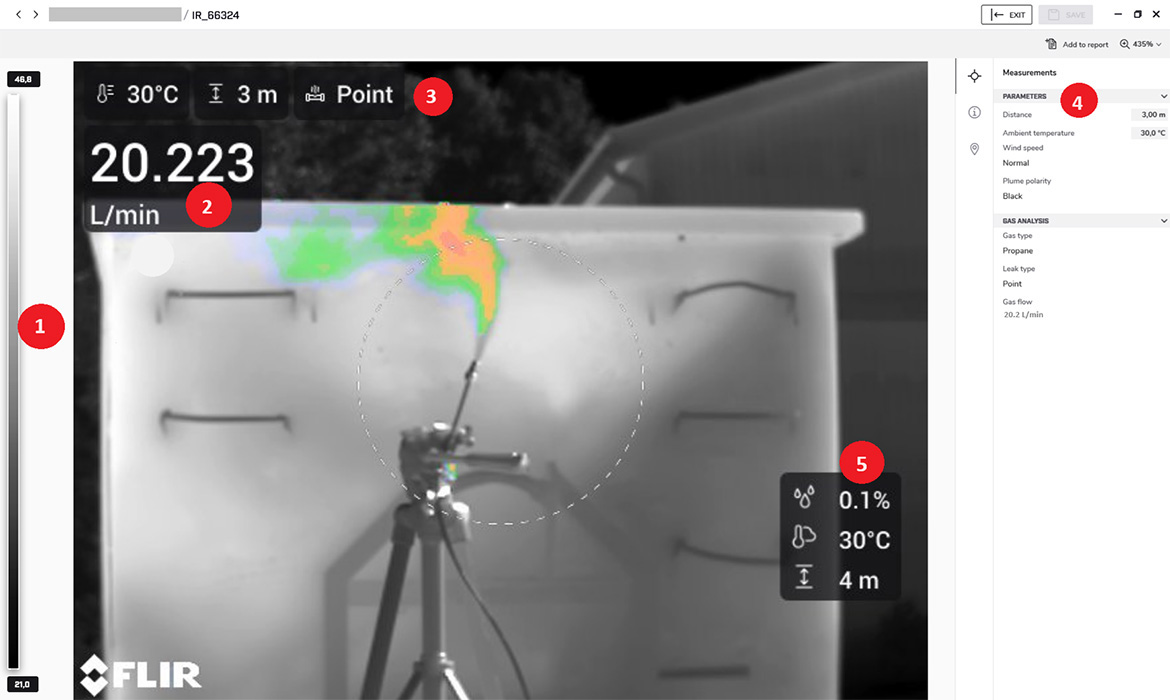
Figure 1. View of .jpg image from editor screen with flow measurement.
Temperature scale
Gas flow or concentration
Quantification overlay parameters
Camera quantification parameters will be visible here.
Measurements
Quantification analysis depends on the parameters settings and the gas analysis results. For more information, see Parameters and Gas analysis.
Camera overlay information
The camera saves the image information such as date, time, and items related to temperature measurements to the image file. The items you have selected to be visible in the camera will be shown here.
Video Controls
Use the controls to play, pause and stop the video recording and to select a specific frame in the video recording.
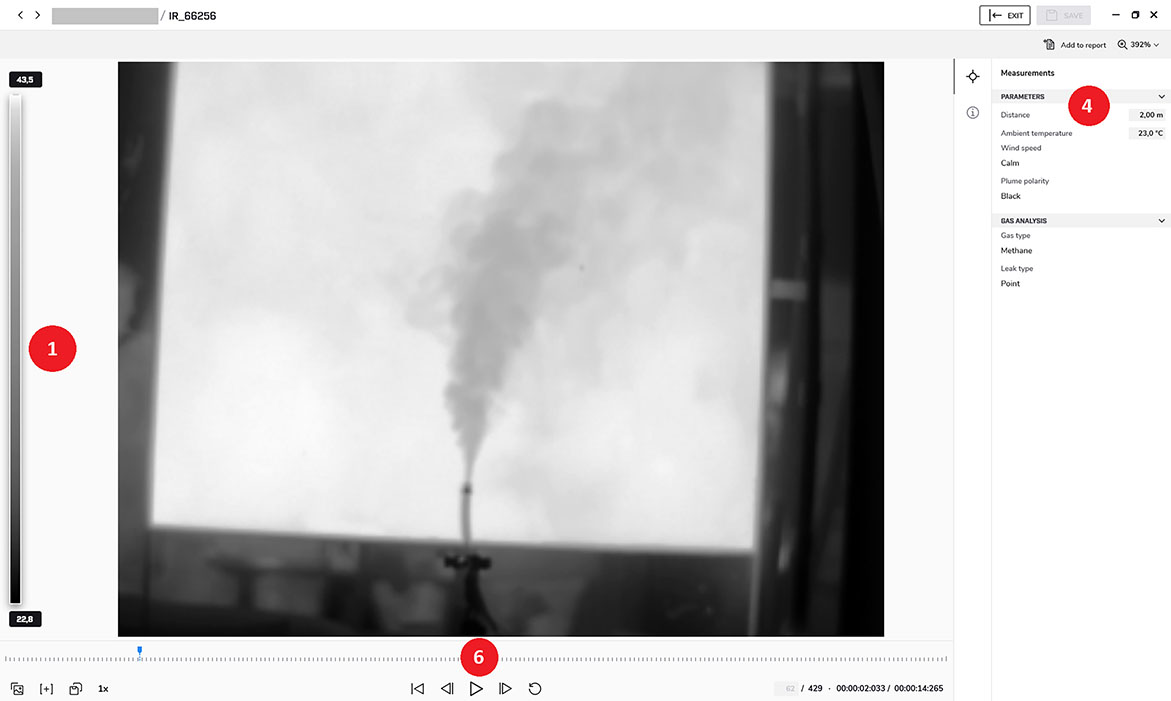
Figure 2. View of .csq video from editor screen.
.csq videos from G-series cameras do not contain overlay information, gas flow or concentration result. Only gas quantification .jpg images contains this information.
Parameters
For accurate quantification results, it is important to set the quantification parameters according to the current conditions. For more information on each parameter and how they affect the results see user´s manual FLIR G series.
Distance
Distance refers to the distance from the camera to the leak.
Ambient temperature
Ambient temperature refers to the temperature of the gas. It is common to use the ambient temperature to represent the gas temperature.
Wind speed
Wind speed refers to the wind conditions during measurement. There are three options: High (> 10 mph), Normal (2-10 mph), and Low (0-1 mph). These general wind conditions are meant to describe the dispersion qualities of the plume being measured.
Plume polarity
Refers to the polarity of the plume that was measured. There are two options, black or white.
Gas analysis
The gas analysis results are displayed on the right pane. The operator in the camera sets the gas and the leak type parameters. The gas flow is the quantification measurement. These values cannot be changed in the software.
Gas type
Gas type refers to the measured gas composition. There are seven gas types available. Propane, Methane, Propylene, Ethylene, Ethane, n-Butane and Benzene.
Leak type
Leak type refers to the geometry of the leak. There are two available options: Diffuse and Point.
Gas flow
Displays the gas flow unit in cc/min as standard. This value can be changed in Thermal Studio to correspond to gas flow value seen in the overlay. Go to Settings-> Language and region and select your gas flow unit. You can select from eight different units. Cc/min, L/min, cm/h, MT/h, lb/h, g/h, SCF/h, and MCF/d.
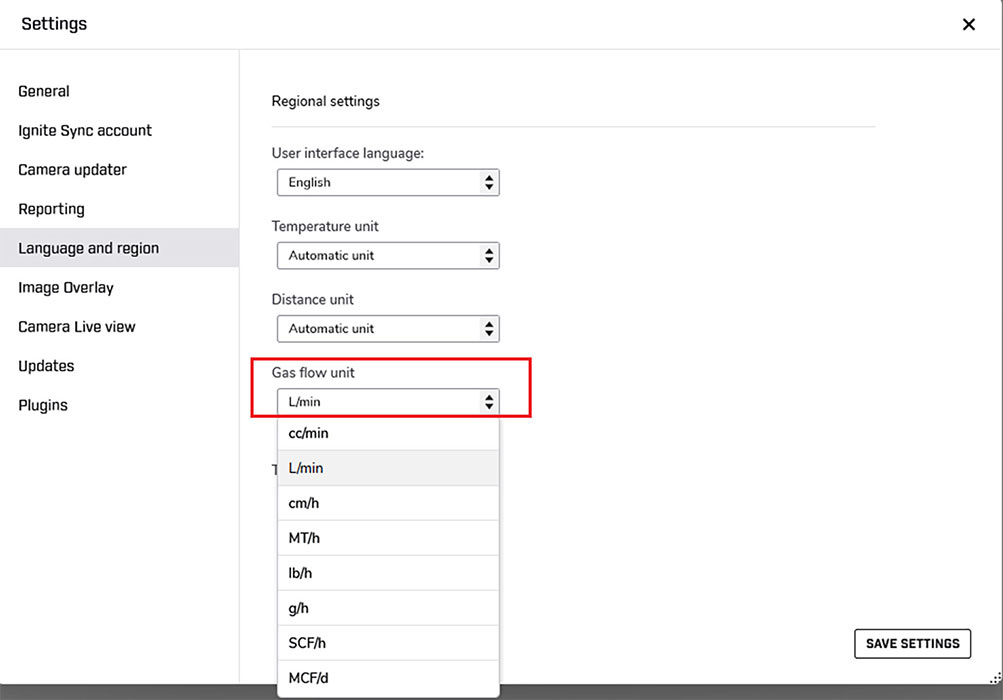
Figure 3. View from the settings menu.
Gas concentration
Displays the gas concentration in PPM-M (Parts Per Million Per meter).
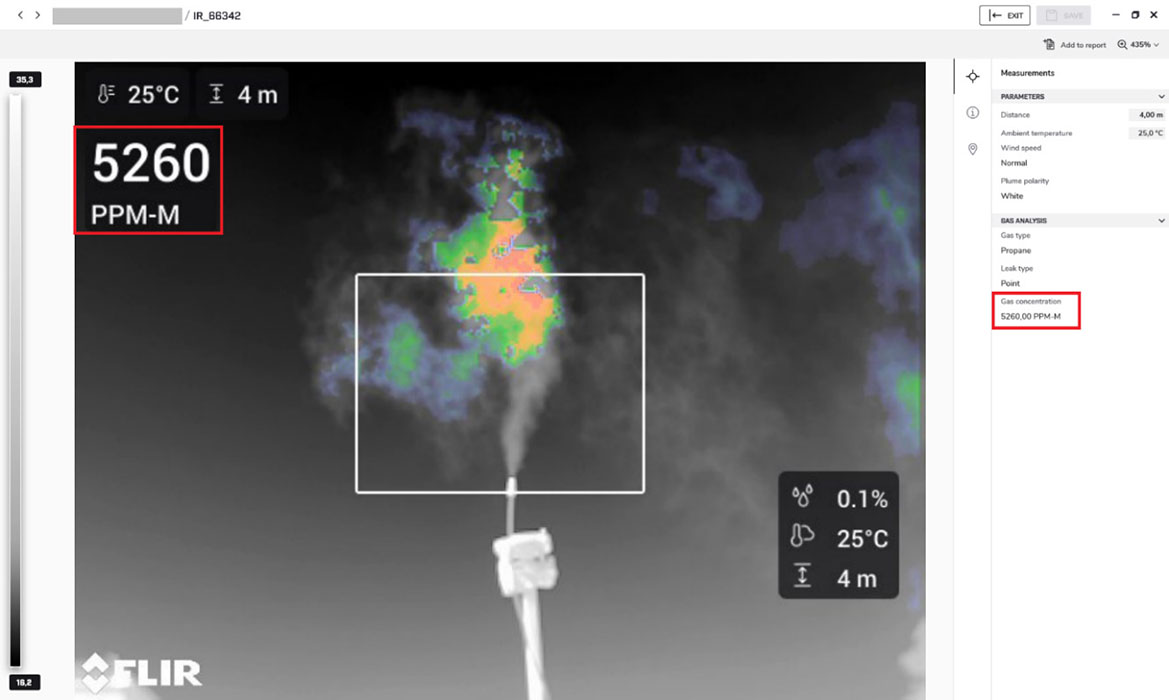
Figure 4. View of .jpg image from editor screen with concentration measurements.
Reporting
Gas quantification report template
The Pro version of Thermal Studio comes with predefined templates for gas quantification. You can find the available templates under “Gas report templates” from the reporting tab.
If these templates do not meet your requirements, you can create your own custom templates. For more information, see Create a reporting template.
Rapid report
You can easily create gas quantification reports using shortcuts on your computer desktop. For more information, see Generate a report using Rapid Report.
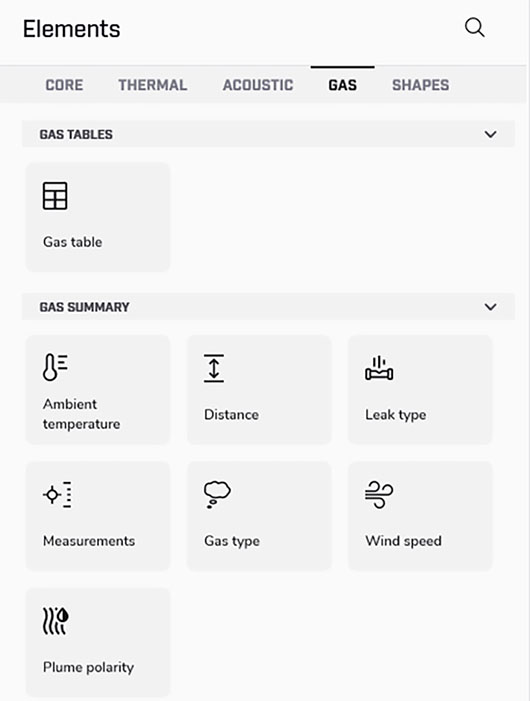
Gas quantification objects
You can add gas specific object such as tables, leak type, gas type etc. to templates and reports. For more information, see Edit reports and templates.