Acoustic videos and images
This chapter describes how to view, edit, and create reports based on acoustic videos and images from the FLIR acoustic cameras.
The acoustic functionality is available as a plug-in. For information on how to activate the Acoustic plug-in, see Plug-in activation.
Acoustic cameras
The FLIR acoustic cameras can be used to locate and quantify air and gas leaks, partial discharges, and mechanical faults.
The acoustic video and image files from the FLIR acoustic cameras have the extension nlz.
For more information, refer to the FLIR acoustic camera user manuals.
View and edit videos and images
You can open the acoustic video and image files (.nlz) using FLIR Thermal Studio.
On the Library tab, you can view your acoustic videos and images. When you click an acoustic file in the center pane, the analysis results and other information are shown in the pane to the right. For videos, the displayed results and information relate to the last frame in the video recording.
To edit a video or image, double-click the file or click Edit image in the right pane. This opens the image editor. This image shows what the image editor looks like when you have selected an acoustic video.
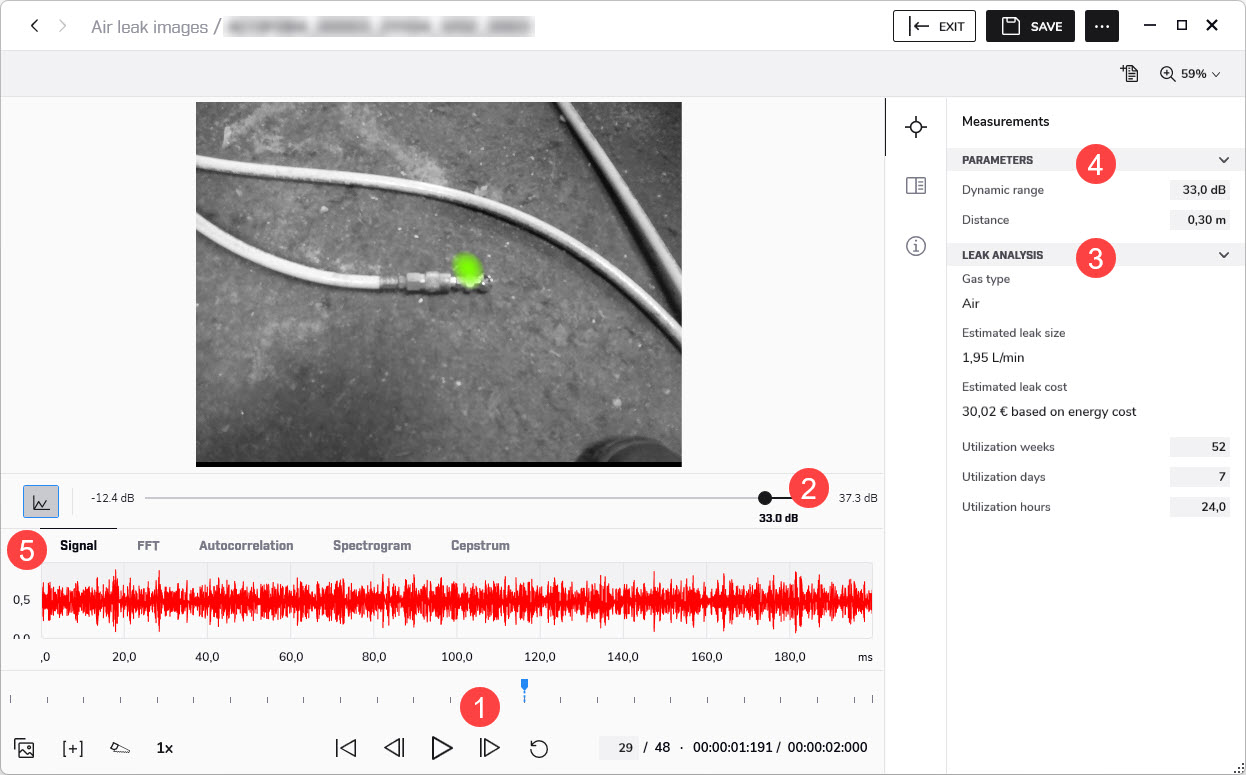
Video controls.
Use the controls to play/pause/stop the video recording and to select a specific frame in the video recording. Note that the analysis results in the right pane relate to the currently displayed frame.
Dynamic range.
By changing the dynamic range, you can analyze the snapshot in more detail – you can decrease the range to get the precise location of the sound source, and increase it to see if there are multiple sound sources. To change the dynamic range, use the slider under the image or enter the level in the Dynamic range field in the pane to the right.
Analysis results.
The mode specific analysis results for leak detection, partial discharge, or mechanical faults are displayed. For more information, see sections Leak analysis, Partial discharge analysis, and Mechanical fault analysis.
Parameters.
The analysis results depend on the Parameters settings. The leak analysis results also depend on the leak analysis settings, see section Leak analysis parameters.
Audio analysis tools.
The sound signal from the dominant source in the image can be visualized in different ways:
Signal is a waveform representation of the audio signal as a function of time.
FFT shows the magnitude spectrum of the signal.
Autocorrelation is the correlation of the signal with itself.
Spectogram is a frequency spectrum of the signal in the function of time.
Cepstrum can be used for analyzing the periodicity of the spectrum.
Leak analysis
The leak analysis results are displayed in the right pane:
Estimated leak size: The estimated size of a detected leak.
Estimated leak cost: The estimated cost of a detected leak. The estimate is based on the type of cost (mass/energy/volume) selected in the camera.
The Gas type displayed in the right pane is the gas that the operator selected in the camera. The system needs this information to assess the leak size accurately.
The accuracy of the leak size and leak cost estimates depends on the leak analysis parameters and settings:
The leak analysis parameters are available in the Settings window, see section Leak analysis parameters.
In the right pane, you can describe how often the equipment is being used in practice by entering the utilization in weeks, days, and hours. The resultant utilization figure will be used as a factor in the leak cost calculations.
In the right pane, you can adjust the Distance setting.
Leak analysis parameters
The leak analysis parameters are available on the Plugins tab in the Settings window, see section Settings.
Currency
The currency to use for the displayed leak cost.
NoteIf you change the Currency setting, the energy, volume, and mass cost settings must be updated accordingly.
Leak unit
The unit to use for the displayed leak size.
Energy cost
The Energy cost (price per kWh).
Volume cost
The Volume cost (price per cubic meter).
Mass cost
The Mass cost (price per kilogram).
Leak correction factor
Since there are many variables that can impact the leak size, the system sometimes underestimates or overestimates the size. If the leak size estimates systematically differ from your own observations, you can set a leak correction factor to adjust the estimate.
Partial discharge analysis
This image shows what the image editor looks like when an image is recognized as a possible partial discharge.
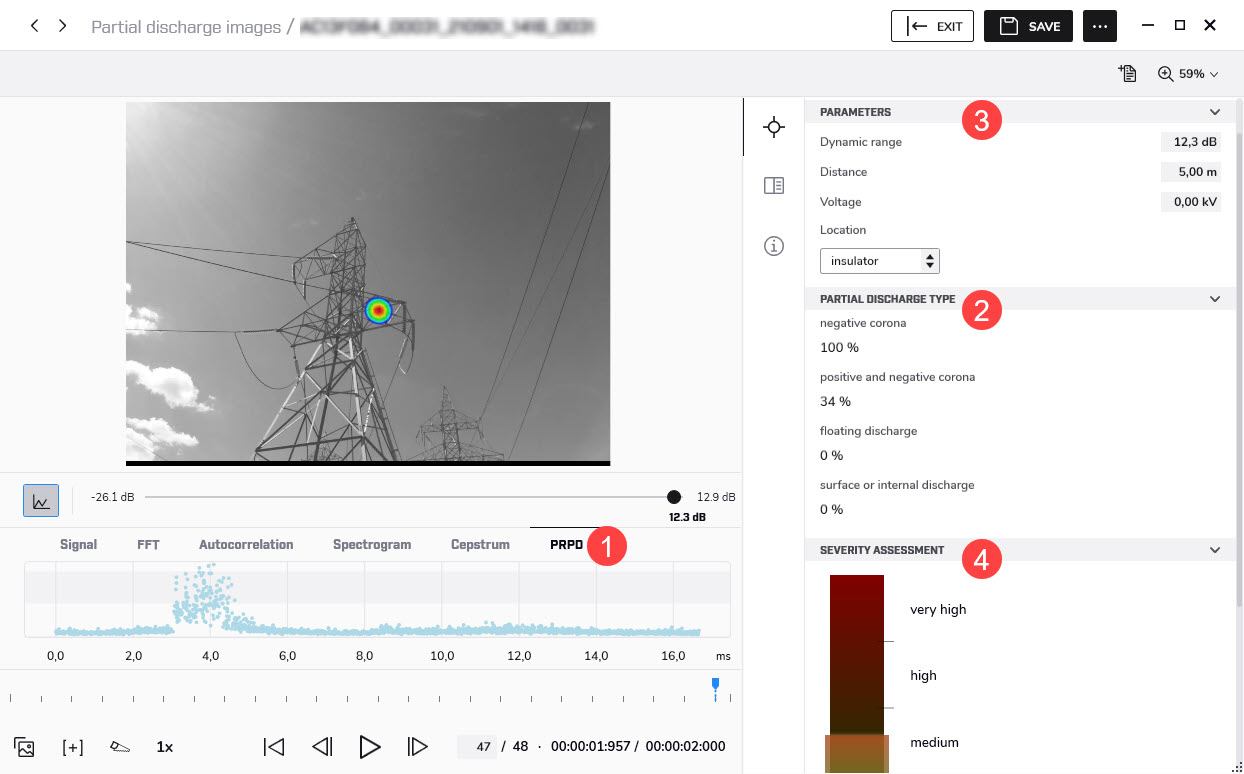
PRPD.
The Phase-Resolved Partial Discharge pattern – or PRPD – is a widely used tool for analysis and diagnosis of partial discharge activity.
Partial discharge activity occurs due to defects in electrical components. Each “dot” in the PRPD pattern corresponds to an event caused by a discharging defect.
There are several different types of partial discharges. Each type typically has a distinct PRPD pattern.
Partial discharge type.
Negative corona
Positive and negative corona
Floating discharge
Surface or internal discharge
The percentage reflects the system’s confidence in identifying a specific type of detected partial discharge. Several types may have approximately the same percentage, which indicates uncertainty about the exact type.
Parameters.
When analyzing partial discharges, the system uses information about the distance, voltage, and type of component. The more exact you specify these parameters, the more precise the severity assessment will be.
Severity assessment.
The severity bar indicates the estimated severity of the detected partial discharge.
The assessed severity is also shown as text. The Description describes the type of partial discharge, while the Recommendation provides suggestions for the actions to be taken.
NoteThe severity assessment only provides general guidelines based on the likely type of partial discharge and the data available. Always consult an expert to decide on the actions that need to, or need not to, be taken when a partial discharge has been detected.
Mechanical fault analysis
The mechanical fault analysis results are displayed in the right pane:
Kurtosis is a measure of the distribution of the samples in the sound signal.
The system shows Kurtosis as "excess" Kurtosis, meaning that a healthy bearing will show a Kurtosis around 0. A Kurtosis of approximately 2 or above is likely to indicate that the bearing condition is getting worse.
Crest factor is the ratio between the peak amplitude and the root mean square (RMS) value of a signal.
The Crest factor of the sound signal from healthy bearings is typically around 5. If the Crest factor is 6 or above, it is an indication that the bearing might need lubrication or is starting to develop faults.
MSI (Mechanical Indicator)
The mechanical severity indicator algorithm detects signs of unevenness and/or friction in the movement of mechanical components such as bearings. With this information, the detected sound assigns a severity indicator. The following severity information is available from acoustic snapshots and videos in Thermal Studio.
Potential fault detected
No fault detected
Reporting
Acoustic report templates
The Acoustic plug-in comes with several predefined acoustic reporting templates, e.g., Automatic acoustic, Discharge Analysis, and Leakage Analysis.
If these templates do not meet your requirements, you can create your own custom templates. For more information, see section Create a reporting template.
Rapid report
You can easily create acoustic reports using shortcuts on your computer desktop. For more information, see section Generate a report using Rapid Report.
Acoustic objects
You can add acoustic objects such as images, tables, plots, and fields to a report. For more information, see chapter Edit reports and templates.